
Introduction
Thermal degradation of synthetic insulation has been a long-time concern in the backpacking community. In July, I wrote an article that explored this topic and described how well two types of synthetic insulation, Climashield Apex 6 osy (ounces per square yard) and Primaloft Gold 6 osy withstood 10 cycles of washing and drying. In that study, Climashield apex demonstrated almost no loss of thermal performance. Primaloft demonstrated minimal loss of thermal performance (about 9%).
Both types of insulations can withstand repeated washing and drying with little loss of performance.
However, backpackers subject their synthetic insulation pieces to another form of torture: compression. Compression occurs when packing garments or sleeping bags into stuff sacks. This can occur repeatedly during a multi-day activity.
This article is my first attempt to quantify whether repeated compression results in the loss of thermal performance. And the answer: a resounding maybe. This round of testing provides some short-term indications. In the short term, minor degradation can occur. In the long term, the significance of this degradation is unclear. What is clear is that this type of testing is extremely time-consuming and assessing long-term performance will require far more test iterations than were completed here. But in the short term, we can say this:
- Degradation is somewhat related to the number of compression cycles.
- Degradation is not influenced by the magnitude of compression, within the compression range studied (0.22 to 0.88 pounds per square inch).
- Thermal performance after compression for an individual test may deteriorate or actually improve. After a compression and recovery cycle, the air spaces within the insulation may change in volume and that change may not be uniform between test cycles. The performance variation in response to repeated compression cycles is small and the direction of change is inconsistent.
- The same types of insulation were tested for this article as were tested for the prior degradation article referenced above. Here, the results are reversed: Climashield Apex showed a greater loss of thermal performance than Primaloft Gold in response to compression. The statistical evidence for the degradation of Primaloft Gold is very weak.
- Finally, the relationship between changes in thermal performance and changes in loft is inconsistent. Part of this may stem from the difficulty of measuring the true effective thickness of high loft insulation.
How We Tested
Compression takes place through two very different mechanisms:
- Stuffing, in which a garment or sleeping bag is loaded, under some pressure, into a stuff sack.
- Utilization pressure, the pressure that results from lying in your sleeping bag or wearing a backpack over a jacket. Part of this pressure may occur beneath backpack straps or may occur due to the pressure of the pack itself on the underlying insulation.
I chose to attempt to replicate pressure placed directly on insulation in the bottom of a sleeping bag by an average male. I estimated pressures exerted by the average adult male using references 1 and 2. Based on these sources, I assumed an average weight of 202 pounds (92 kg) and an average skin surface of about 25 square feet (2.3 square meters).
The average pressure exerted on the bottom of a sleeping bag was calculated to be approximately 0.14 psi.
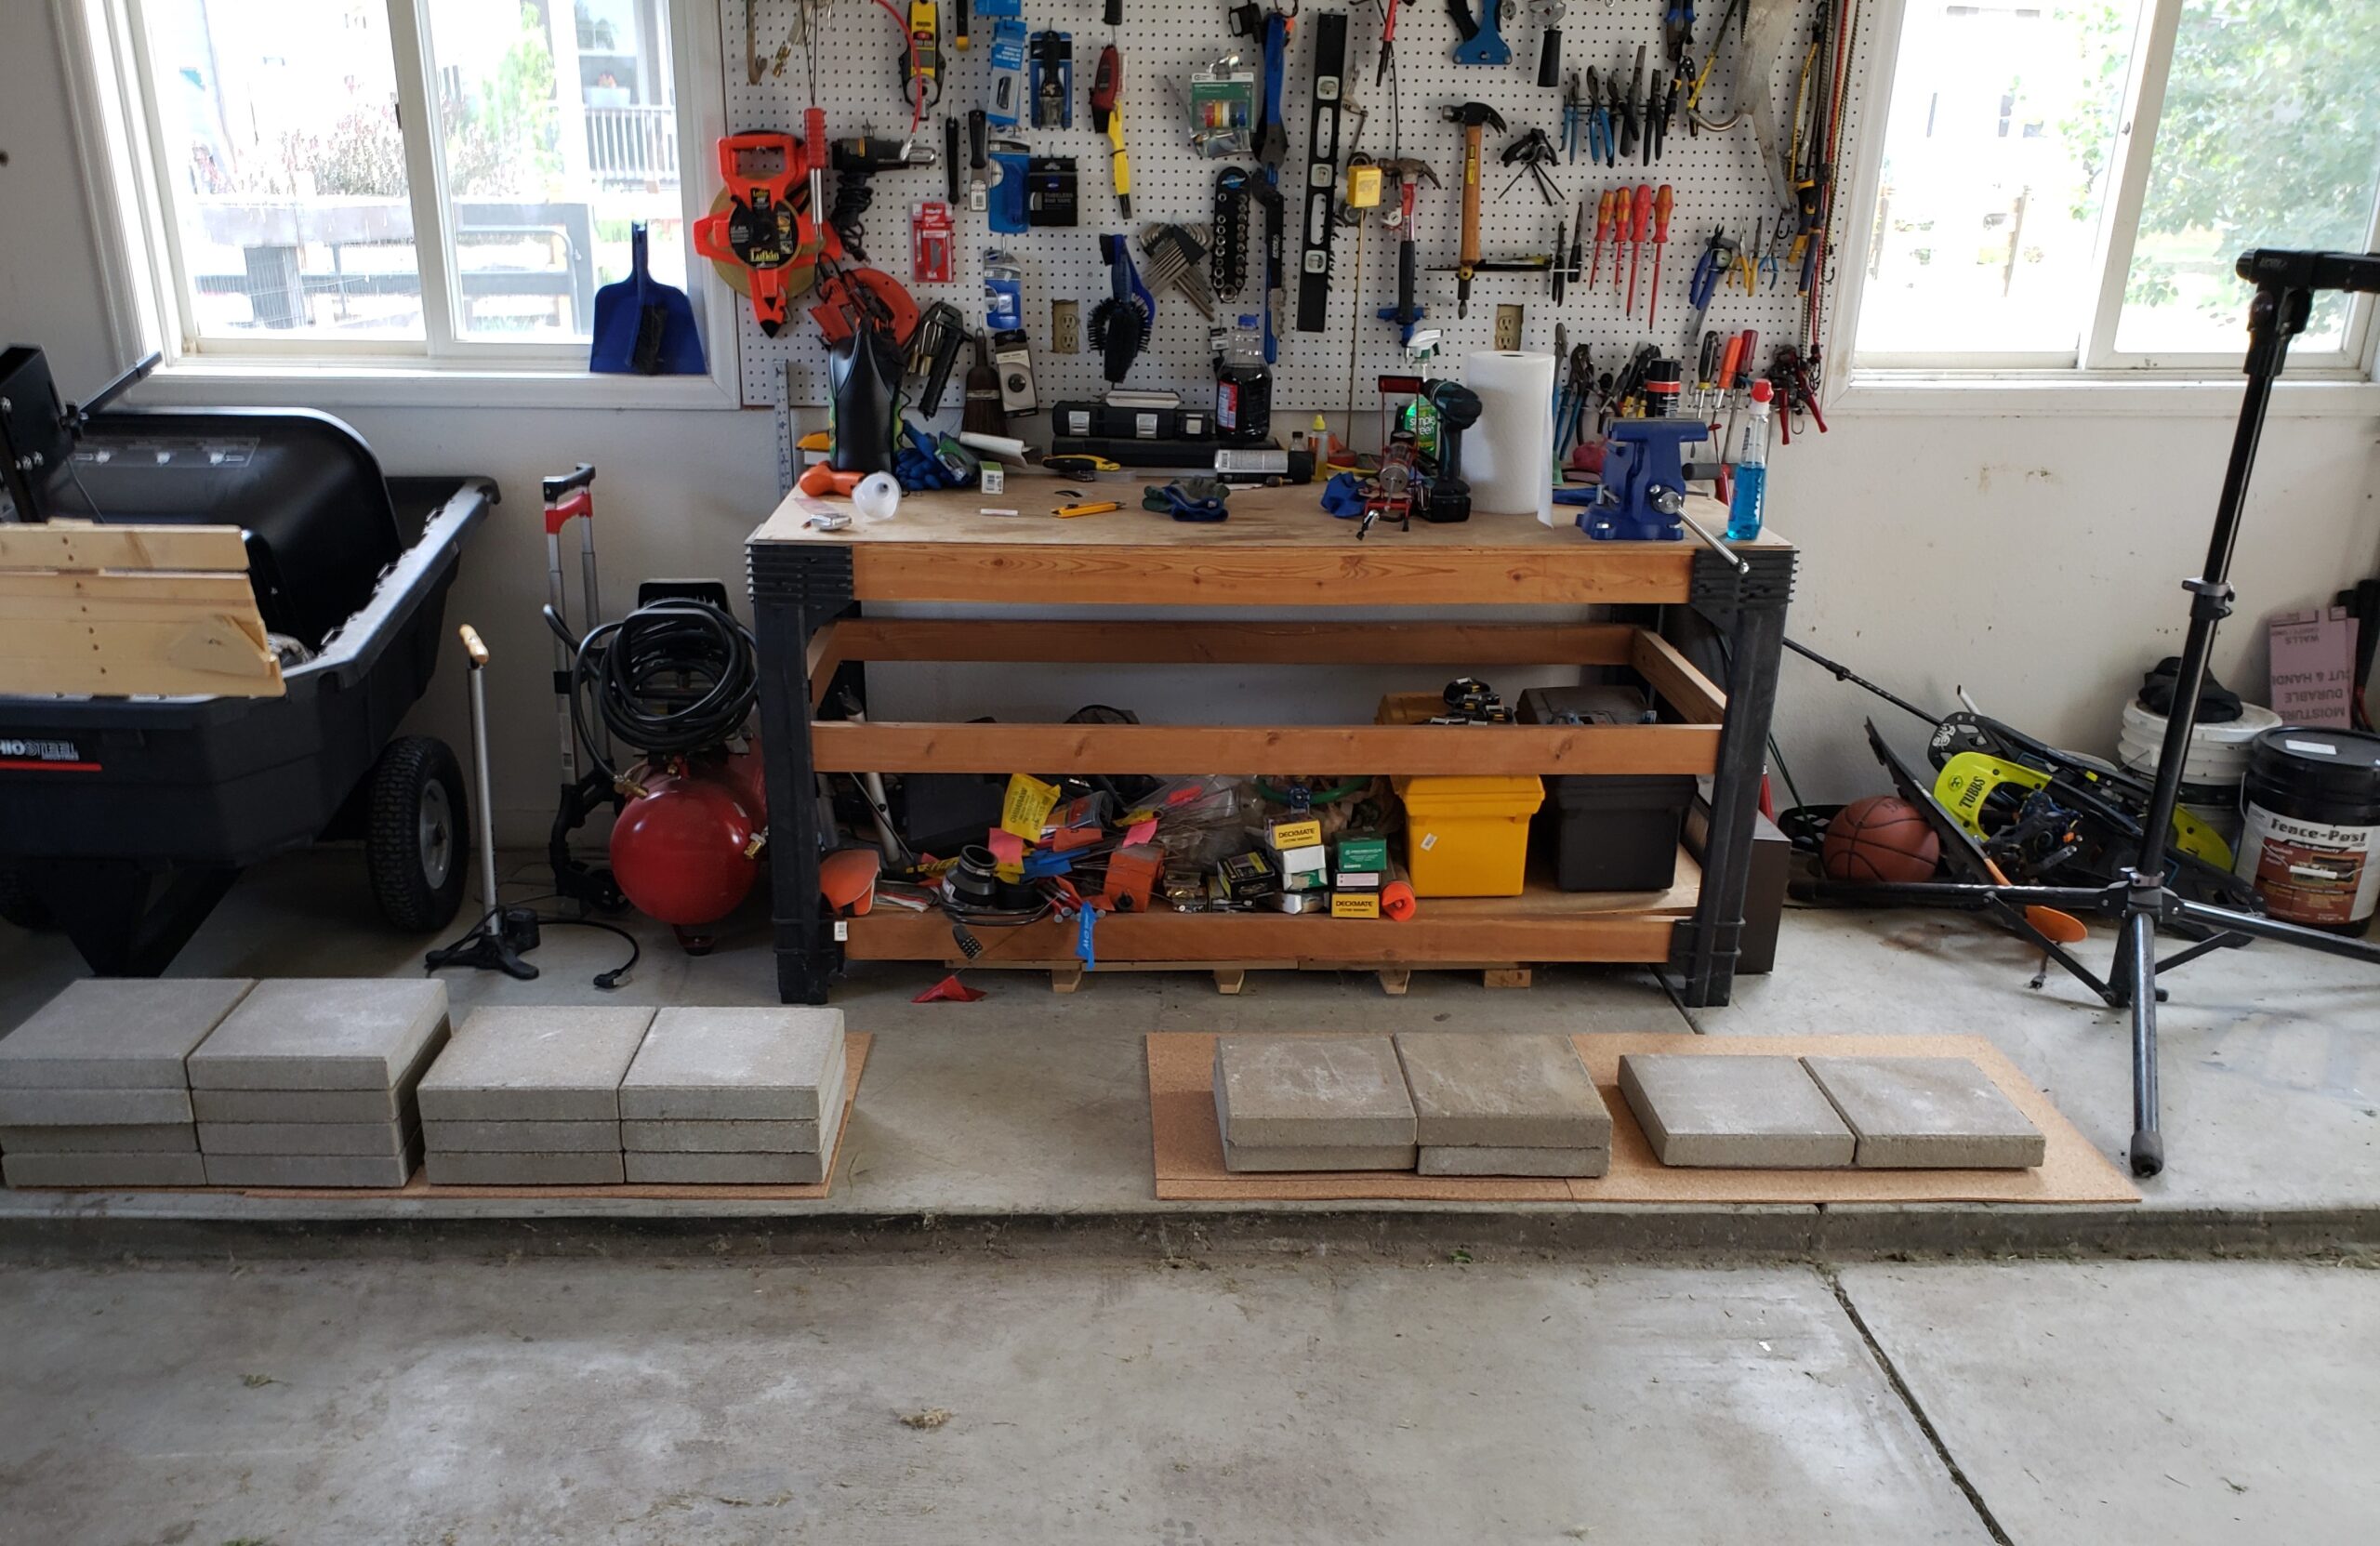
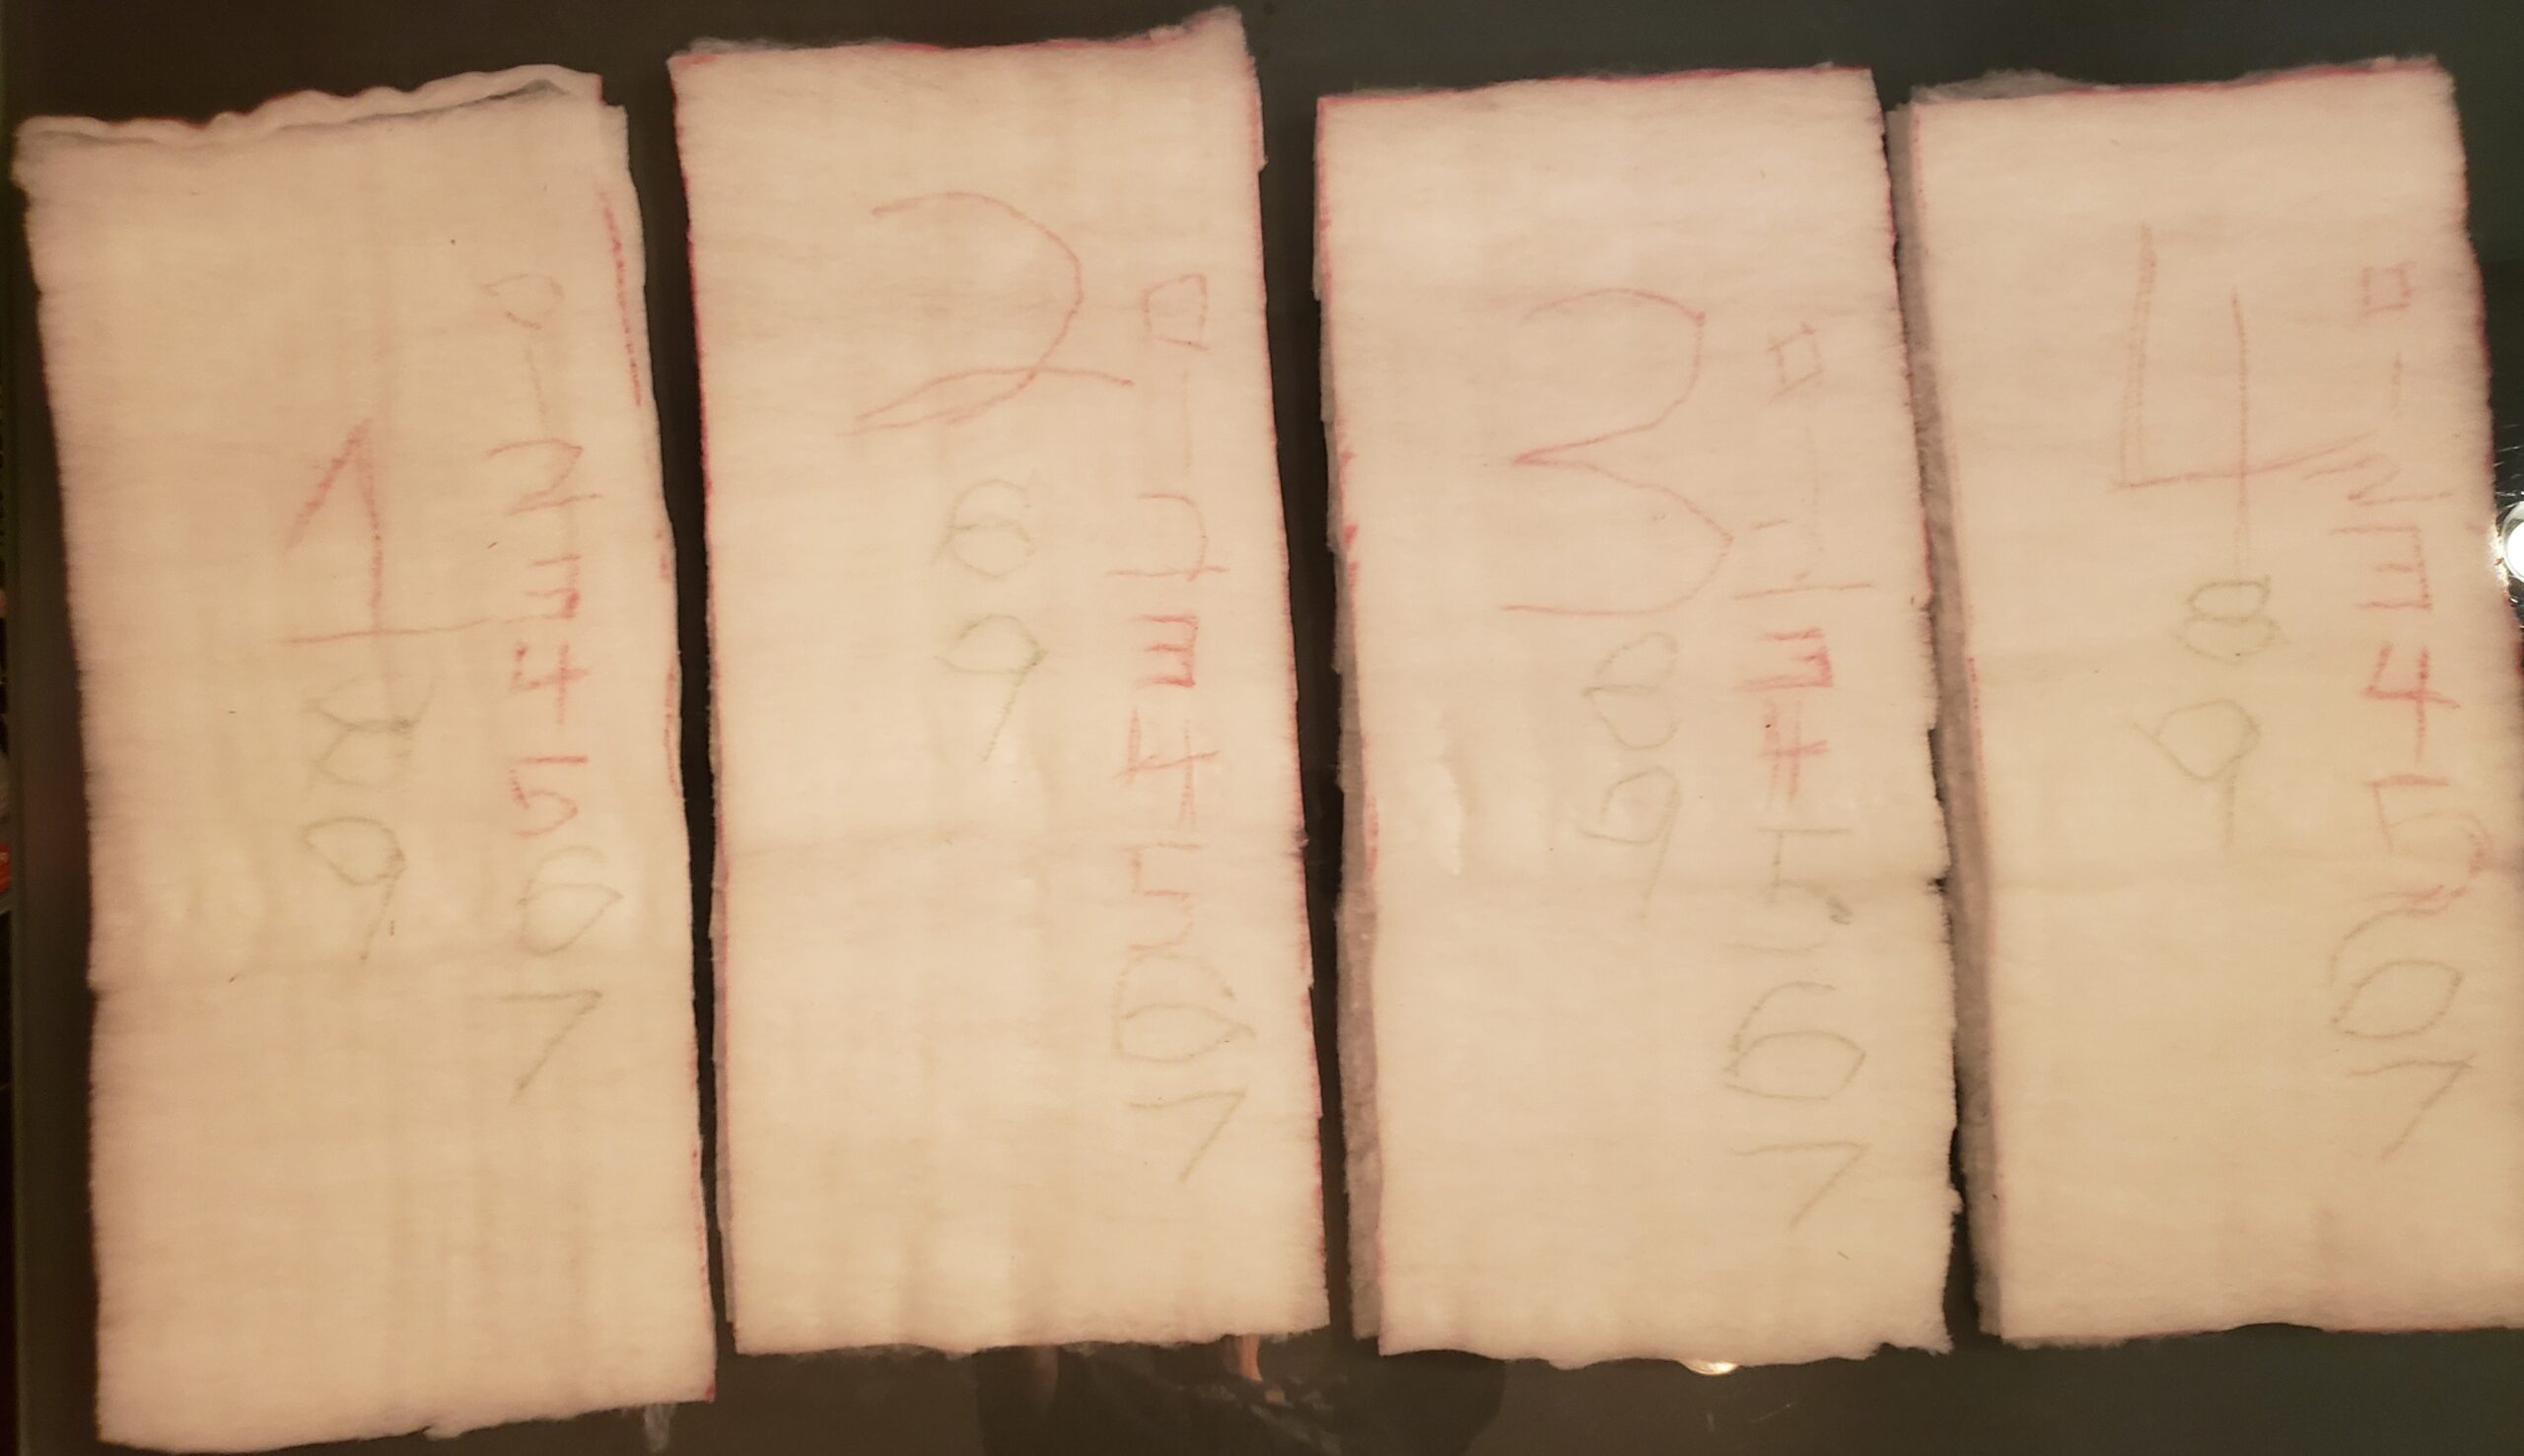
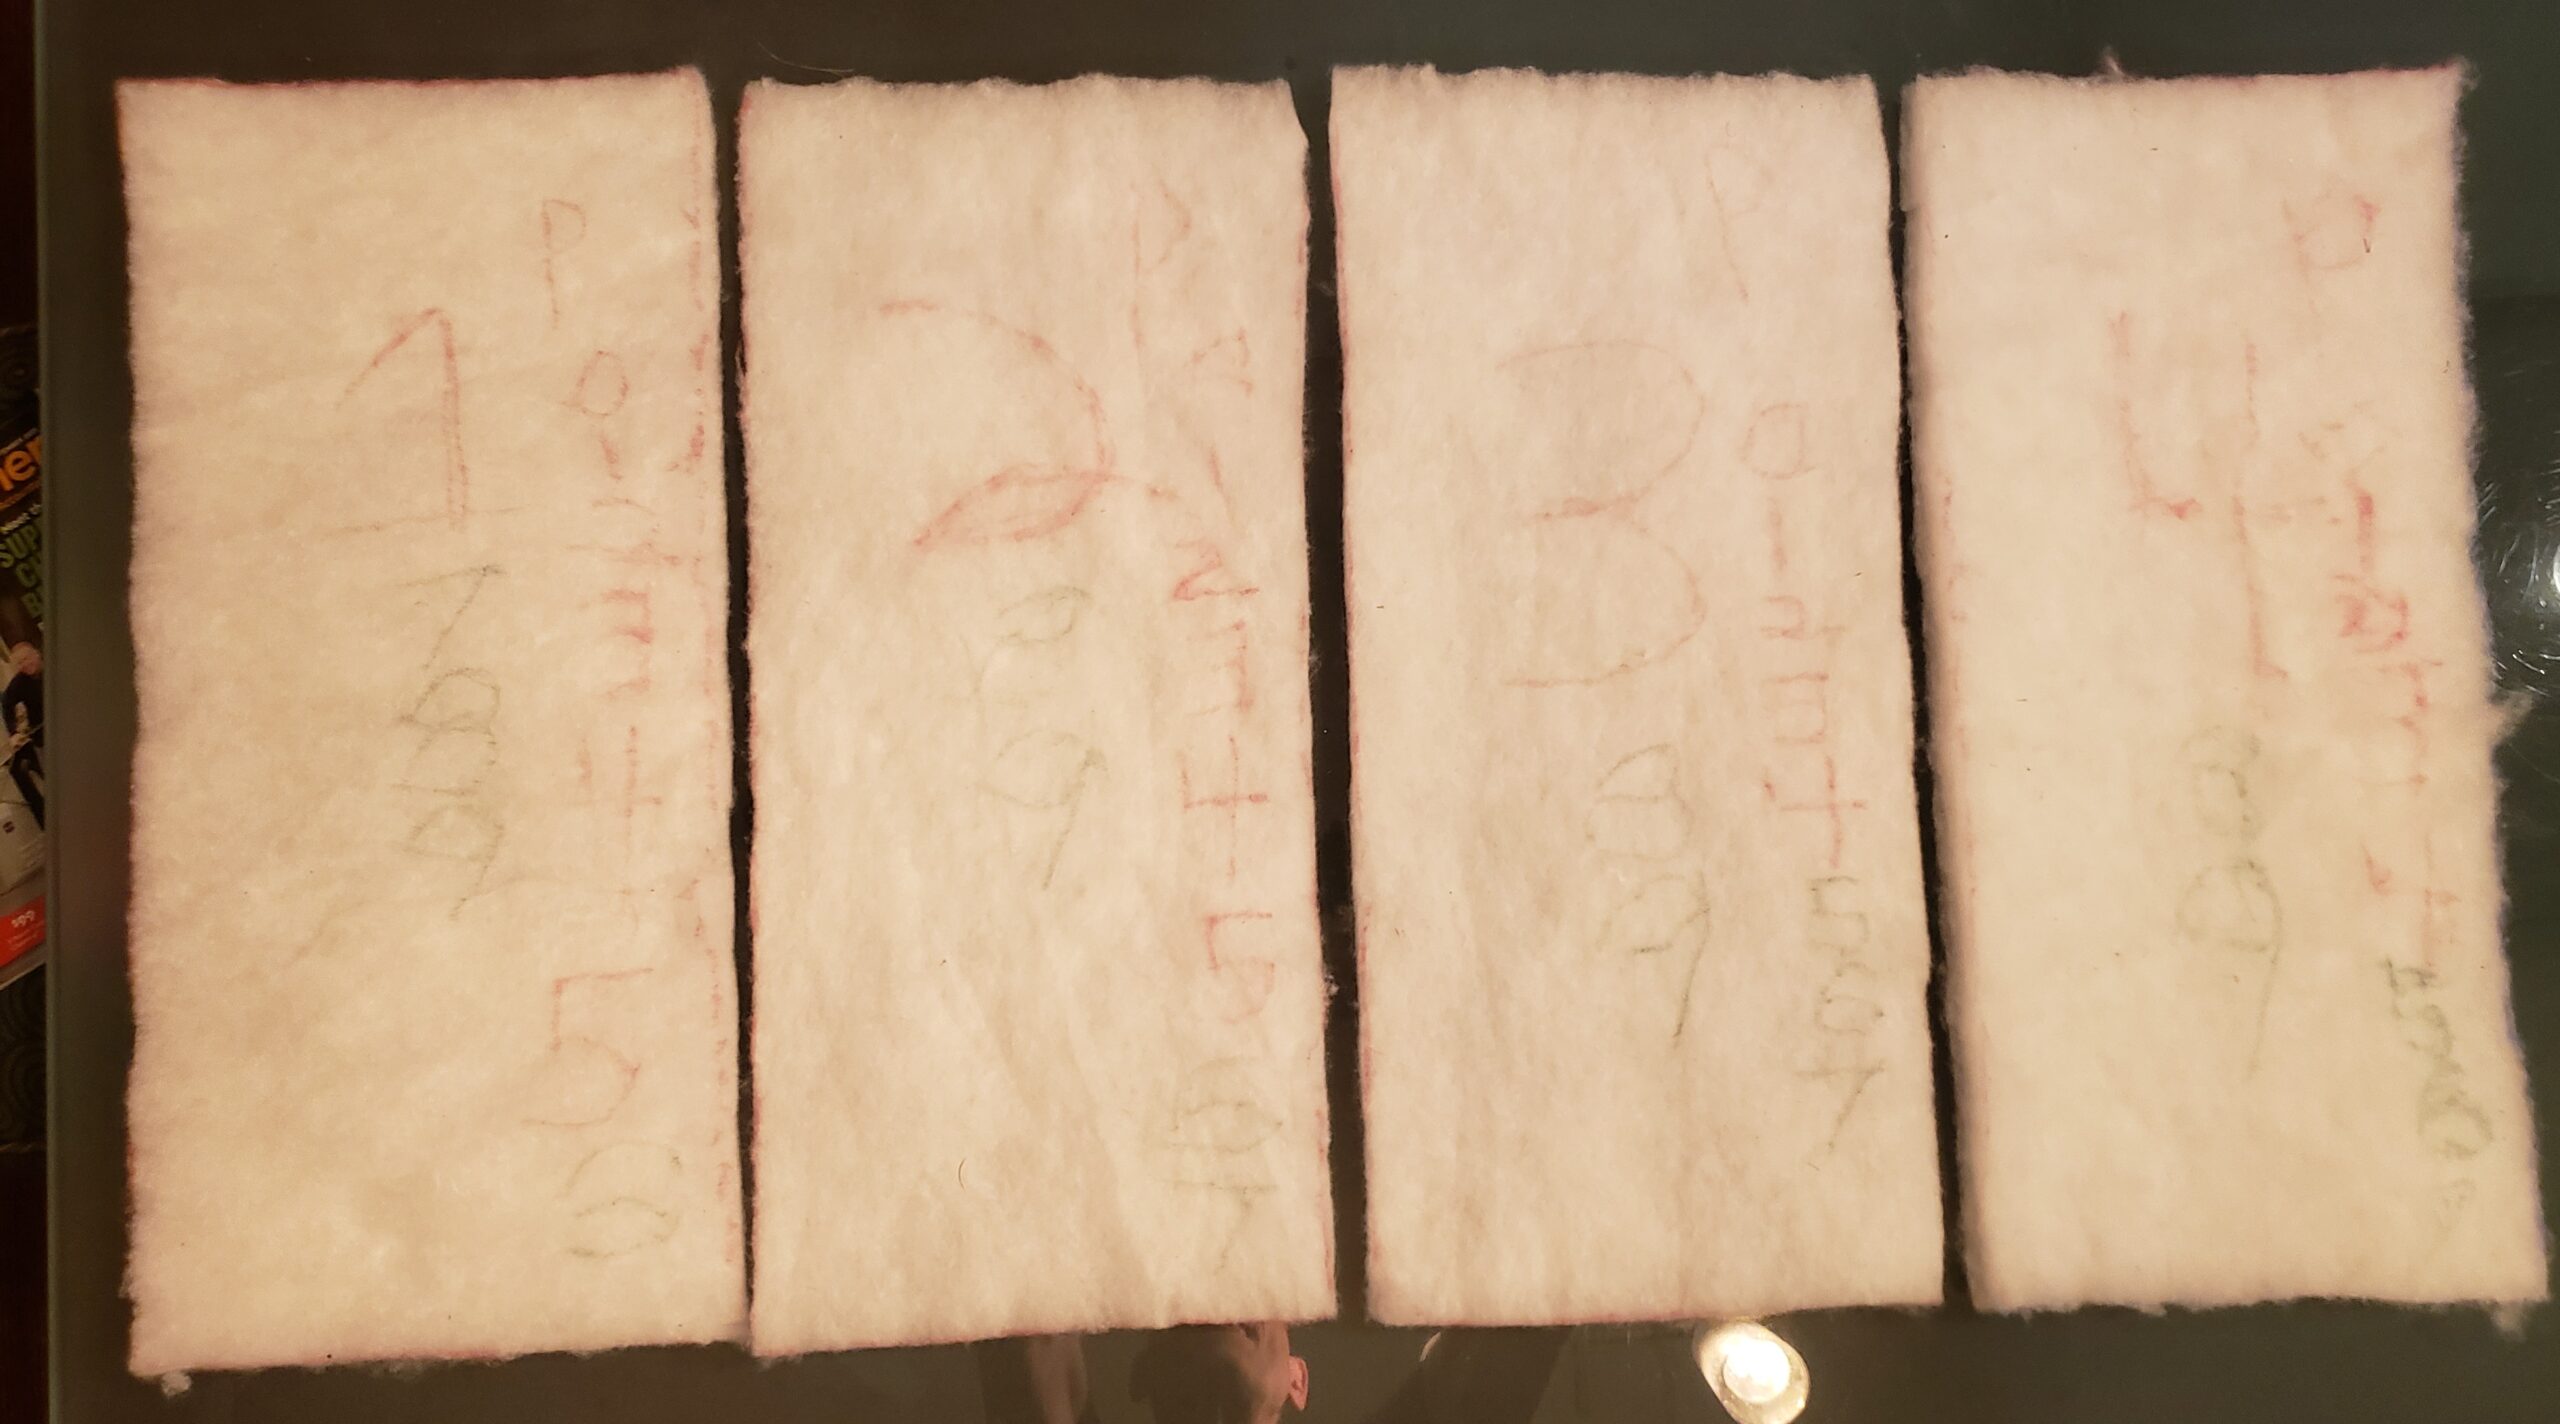
Two types of insulation were tested: 6 osy Primaloft Gold and 6 osy Climashield Apex. Four samples of each were cut from unused insulation to fit my guarded hot plate apparatus. Each sample was compressed by placing concrete pavers on each sample. Each paver weighs 23.4 pounds (10.6 kg). Sample 1 received two pavers, laid side by side, which produces approximately the same pressure as our average male. Sample 2 received four pavers. Sample 3 received six pavers. Sample 4 received eight pavers. Thus, sample 4 received about four times the pressure produced by our average male.
Samples were compressed for approximately 24 hours. After 24 hours, samples were removed and allowed to recover for about 10 hours. Next, the samples were tested for thermal resistance (R-value) on the guarded hot plate. Each test ran for 1 hour. Any test result that appeared to show elevated deviation was retested. Prior to testing, each sample sat on the hot plate for 20 minutes. The guarded hot plate surface was maintained at 100 °F +/- 0.2 °F (37.8 °C +/- 0.1 °C). The ambient environment 20 inches (50.8 cm) above the guarded hot plate was maintained at 71.5 °F +/- 0.5 °F (21.9 °C +/- 0.3 °C).
Each sample was measured for loft following the recovery period. When fabric thickness is measured, a weighted plate is placed on the test sample and the distance from the underside of the plate to the sample mounting surface is measured. High loft insulation cannot support much weight without compressing, so the weight of the plate must be selected carefully. In this case, a rectangle of extruded polystyrene foam with additional small lead weights was used. This plate, along with weights, weighs 5.1 ounces (145 g). A Mitutoyo Digimatic caliper was used to measure the distance from the underside of the plate to the mounting surface. Two measures were taken near corners on each long side. The resulting four measurements were averaged to calculate the loft to the nearest hundredth of an inch. By necessity, this is a somewhat compressed loft. The actual non-compressed loft is unknown and not easily determined due to thickness variation across each insulation sample. Since the sample sits on the guarded hot plate without the 5.1 ounces (145 g) imposed by the measurement plate, the sample loft on the guarded hot plate will tend to be greater than the measured loft. Our loft measurement provides a physical loft dimension that reflects changes in the fabric resilience which will track changes in the compressive strength of the sample fibers. Thus, thermal performance measurements on the hot plate cannot be expected to track measured loft except in the case of substantial changes in measured loft. Substantial changes in loft did not occur.
Test Results
Table 1 shows physical data for the two sets of four insulation samples.
Table 2 shows “as found” R-value and R-values measured after each of the 9 compression tests.
Table 3 shows “as found” loft and loft measured after each of the 9 compression tests.
<!–member-only-content–>
Table 1: Test Sample Physical Data
| Insulation | Weight (g) | As Found Loft (inches) | As Found R-Value | Total Weight on 212 sq in sample (lb) | Test Compression (PSI) |
|---|---|---|---|---|---|
| Apex 1 | 26 | 1.15 | 2.84 | 46.8 | 0.22 |
| Apex 2 | 26 | 1.14 | 2.87 | 93.6 | 0.44 |
| Apex 3 | 28 | 1.16 | 2.98 | 140 | 0.66 |
| Apex 4 | 27 | 1.16 | 2.81 | 187.2 | 0.88 |
| Average | 26.75 | 1.15 | 2.88 | 116.9 | 0.55 |
| - | - | - | - | - | - |
| Primaloft Gold 1 | 26 | 0.83 | 2.42 | 46.8 | 0.22 |
| Primaloft Gold 2 | 22 | 0.84 | 2.48 | 93.6 | 0.44 |
| Primaloft Gold 3 | 24 | 0.84 | 2.32 | 140 | 0.66 |
| Primaloft Gold 4 | 33 | 0.79 | 2.82 | 187.2 | 0.88 |
| Average 1,2,3 | 24 | 0.84 | 2.41 | 93.47 | 0.44 |
Table 2: As found and Measured R-value Data for 9 Compression Tests
| Insulation | As Found R-Value | Test 1 R-Value | Test 2 R-Value | Test 3 R-Value | Test 4 R-Value | Test 5 R-Value | Test 6 R-Value | Test 7 R-Value | Test 8 R-Value | Test 9 R-Value |
|---|---|---|---|---|---|---|---|---|---|---|
| Apex 1 | 2.84 | 2.94 | 2.86 | 2.72 | 2.41 | 2.77 | 2.59 | 2.42 | 2.55 | 2.64 |
| Apex 2 | 2.87 | 2.95 | 2.68 | 2.48 | 2.6 | 2.87 | 2.53 | 2.67 | 2.47 | 2.64 |
| Apex 3 | 2.98 | 2.95 | 2.51 | 2.72 | 2.72 | 2.63 | 2.54 | 2.48 | 2.65 | 2.57 |
| Apex 4 | 2.81 | 2.93 | 2.52 | 2.62 | 2.75 | 2.5 | 2.63 | 2.46 | 2.59 | 2.6 |
| Average | 2.88 | 2.94 | 2.64 | 2.64 | 2.62 | 2.69 | 2.57 | 2.51 | 2.57 | 2.61 |
| - | - | - | - | - | - | - | - | - | - | - |
| Primaloft Gold 1 | 2.42 | 2.13 | 2.08 | 2.19 | 2.4 | 2.31 | 2.17 | 2.23 | 2.36 | 2.34 |
| Primaloft Gold 2 | 2.48 | 2.19 | 2.03 | 1.96 | 2.2 | 2.17 | 2.12 | 2.09 | 1.98 | 2.15 |
| Primaloft Gold 3 | 2.32 | 2.13 | 2.03 | 2.03 | 2.31 | 2.11 | 2.12 | 2.28 | 2.07 | 2.21 |
| Primaloft Gold 4 | 2.82 | 2.67 | 2.72 | 2.55 | 2.69 | 2.49 | 2.6 | 2.74 | 2.8 | 2.97 |
| Average 1,2,3 | 2.41 | 2.15 | 2.05 | 2.06 | 2.3 | 2.2 | 2.14 | 2.2 | 2.14 | 2.23 |
Table 3: As Found and Measured Loft Data for 9 Compression Tests
| Insulation | As Found Loft | Test 1 Loft | Test 2 Loft | Test 3 Loft | Test 4 Loft | Test 5 Loft | Test 6 Loft | Test 7 Loft | Test 8 Loft | Test 9 Loft |
|---|---|---|---|---|---|---|---|---|---|---|
| all values in units of inches | - | - | - | - | - | - | - | - | - | - |
| Apex 1 | 1.15 | 1.09 | 1.06 | 0.97 | 1.06 | 1.06 | 1.04 | 1.02 | 0.98 | 0.99 |
| Apex 2 | 1.14 | 1.06 | 1.01 | 0.96 | 0.99 | 1 | 0.97 | 0.98 | 0.94 | 0.97 |
| Apex 3 | 1.16 | 1.07 | 1.04 | 0.98 | 1 | 1.01 | 1 | 0.99 | 0.94 | 0.95 |
| Apex 4 | 1.16 | 1.08 | 1.07 | 0.97 | 1.02 | 0.99 | 0.97 | 0.98 | 0.97 | 0.97 |
| Average | 1.15 | 1.08 | 1.05 | 0.97 | 1.02 | 1.02 | 1 | 0.99 | 0.96 | 1.01 |
| - | - | - | - | - | - | - | - | - | - | - |
| Primaloft Gold 1 | 0.83 | 0.77 | 0.67 | 0.71 | 0.75 | 0.74 | 0.76 | 0.76 | 0.67 | 0.69 |
| Primaloft Gold 2 | 0.84 | 0.68 | 0.7 | 0.63 | 0.69 | 0.64 | 0.67 | 0.7 | 0.68 | 0.66 |
| Primaloft Gold 3 | 0.84 | 0.7 | 0.69 | 0.64 | 0.7 | 0.62 | 0.68 | 0.7 | 0.62 | 0.61 |
| Primaloft Gold 4 | 0.79 | 0.75 | 0.78 | 0.77 | 0.81 | 0.79 | 0.82 | 0.81 | 0.76 | 0.76 |
| Average 1,2,3 | 0.84 | 0.72 | 0.69 | 0.66 | 0.71 | 0.67 | 0.73 | 0.74 | 0.68 | 0.68 |
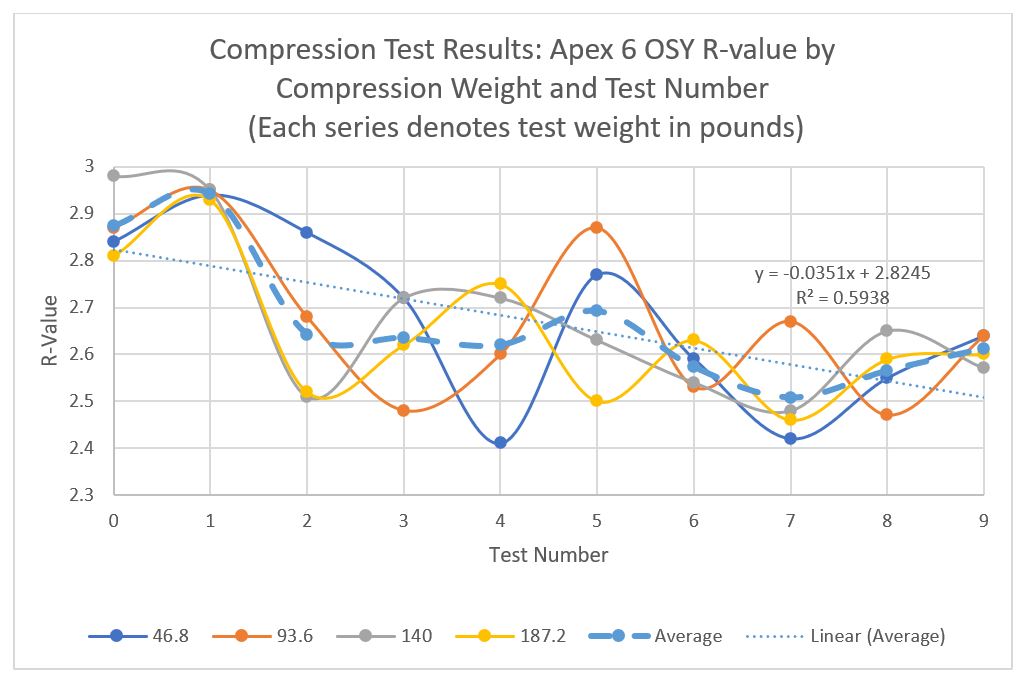
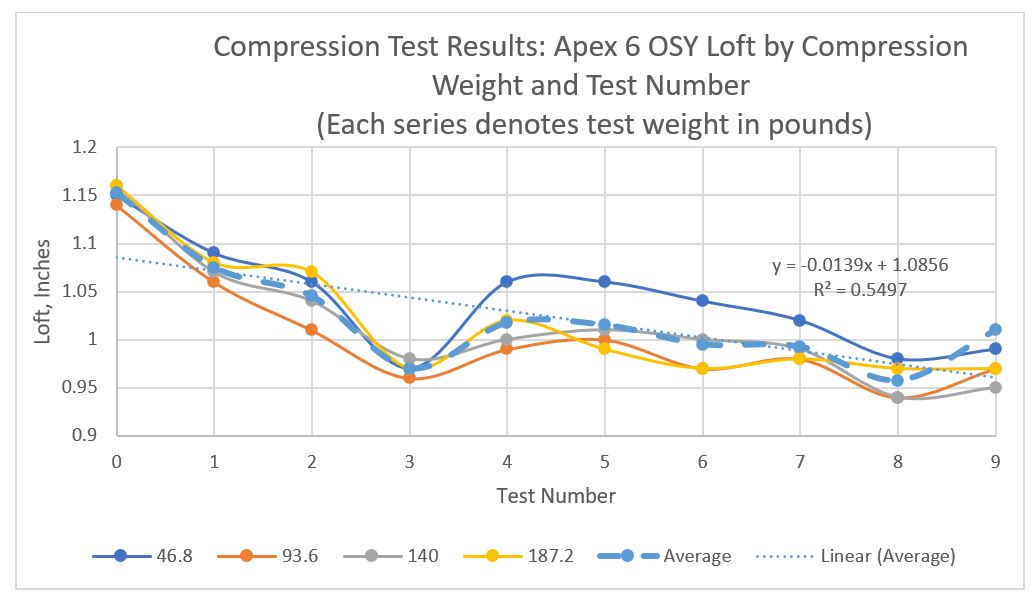
Figures 2 and 3 show graphical results of the R-value data and Loft data for Apex.
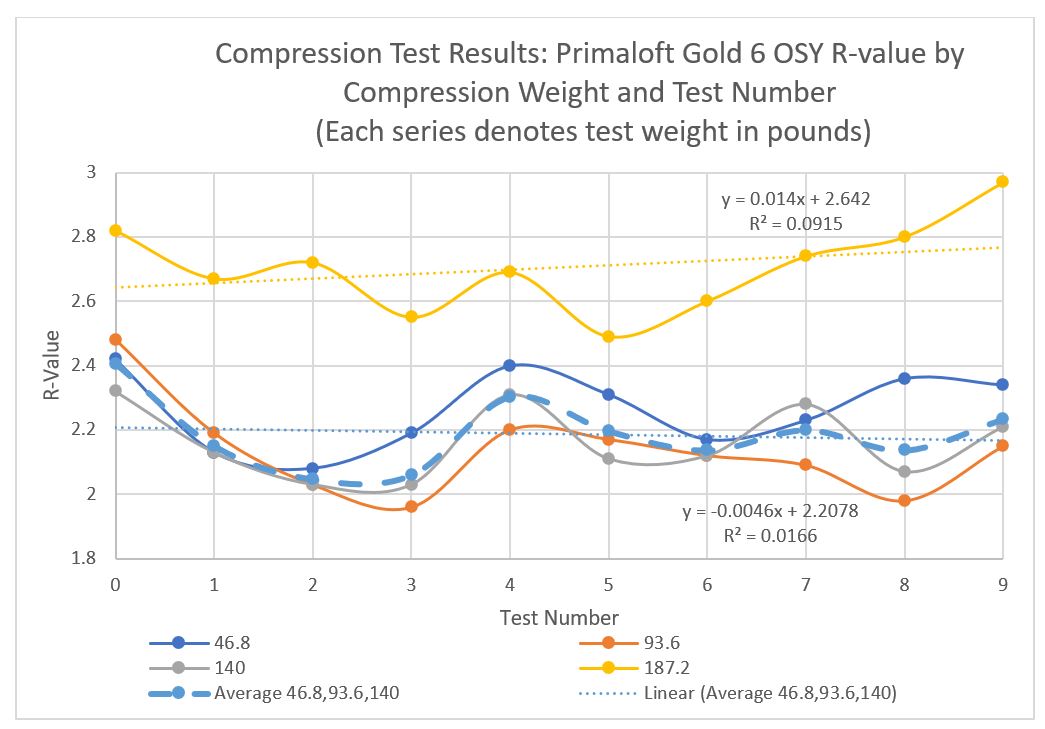
Figures 4 and 5 show graphical results of the R-value data and Loft data for Primaloft Gold.

Discussion of Results
The test results may be most easily understood through the graphical data presented in Figures 2-5.
On each graph, test 0 is the as found value for R-value or loft.
Each graph contains multi-colored plots. Each plot corresponds to the pressure applied to the insulation sample. There is a dashed line which is the plot of averages.
Originally, I expected that both the R-value and loft would degrade more rapidly for the more heavily weighted samples. In fact, observation of the plots shows no evidence of this. If this had occurred, the plot for the 187-pound plot would show consistently lower values and steeper decline than the 47-pound plot. This type of divergence is not present. So, we can conclude that the compression weight does not increase the rate of insulation degradation. It may matter for compression values lower or higher than the pressure range that was tested. It appears that degradation, to the extent it occurs, is simply a function of the number of compressions.
The changes in R-values show no specific response pattern to compression. We can see R-values both rise and fall for each compression series and there is no consistent pattern for this. It seems that the best way to discern any underlying pattern is to calculate the average value for the four samples included in each compression cycle. We can then look for a strong trend in the average behavior.
The blue dashed line is the average for each of the samples by test number. It is not a smooth curve. Each graph contains a simple linear curve fit of the average data. This is denoted by a dotted line. At the right end of each dotted line, we can see the curve fit equation and the coefficient of determination (R2) for the best-fit curve. We can look at the linear curve fit data to get two pieces of information:
- How good is the curve fit for predicting R-value or loft as a function of the number compressions?
- How much can we expect R-value or loft to fall (or rise) as a function of the number of compressions?
In terms of the quality of predictive value, we simply can look at the R2 value for each plot. In terms of how sharply degradation might be occurring, we can look at the straight-line curve fit equation. In particular, the slope of the line is provided by the first term of the line fit equation. If a negative sign is present, the line will slope down and the R-value will decline with more compressions. The larger the slope number, the greater will be the rate of change with each compression cycle.
The R2 values for the Apex plots are moderately high (indicating a data trend that may be statistically predictable) at over 0.5 for both R-value and loft. The slope of both equations is negative, meaning that R-value and loft are decreasing with the number of tests. R-value decreases by almost 0.04 for each compression cycle. The loft decreases by about 0.01 inches (0.025 cm) per compression cycle. This consistent degradation is contrary to my expectations. I expected that Apex, being continuous filament insulation, would not show continuous degradation with compression. My expectations are not supported by the test results.
For the Primaloft Gold graphs, we find two curve fit equations on each. The yellow dotted plot corresponds to Sample 4. The blue dotted plot corresponds to the average of samples 1, 2 and 3. We can see that the R-value for sample 4 is consistently higher than R-values for samples 1, 2, and 3. During the course of testing, I ran out of Primaloft Gold insulation. I had enough for three test samples. These are samples 1, 2, and 3. I obtained the 4th sample from insulation I purchased in the middle of 2020. This sample has a consistently higher R-value than samples 1, 2, and 3. It also weighs more than samples 1, 2, and 3. The performance of sample 4 is clearly different than that of the other samples. Thus, sample 4 has its own trend line and the average of samples 1, 2, and 3 are used to produce the second trend line.
The R2 values for Primaloft Gold are extremely weak for both trend lines. The low R2 indicates that repeated compression has little or no impact on R-value or loss of loft for Primaloft Gold. The curve fit equations for samples 1, 2, and 3 show little to no degradation in R-value or loft. In the case of sample 4 R-value, an increase in R-value is found as testing continues. The lack of thermal degradation of Primaloft Gold is also contrary to my expectations.
In all of these plots, the use of a straight-line curve fit is misleading. This suggests that at some number of compressions, the insulation will have no thermal insulation value and no loft. This, of course, will not happen. The degradation of these insulations, if occurring, should level out at some point. The use of a polynomial curve fit can reflect such behavior and it does increase the R2 values somewhat. However, polynomial curves actually start to trend upward for R-values in these plots, suggesting that repeated compression cycles will ultimately result in higher thermal performance! This outcome seems unlikely in the long run. Unfortunately, we don’t really know what the longer-term outcome looks like based on only nine compression cycles.
Conclusions
It is obvious that not enough compression cycles were conducted here to get a better understanding of long-term synthetic insulation behavior. I intend to continue this study, but with a somewhat different approach. In the next round of testing, I will continue with only samples 1 and 3 for each type of insulation. I will compress and then permit relaxation for two cycles for the two insulations and then measure thermal resistance and loft. This will dramatically speed up the testing process and reduce the labor requirement. It will still take considerable time, so expect another installment on this subject after at least a couple of months.
These tests revealed that R-value can rise as well as decrease as a result of compression. This is another unexpected outcome of this test. What appears to be happening is that loft recovery is inconsistent, and the air entrapment characteristics of the insulation actually change. At times, it appears to actually increase air entrapment and at others, air entrapment decreases, and the R-value is reduced. I suspect that the bonding of fibers within the insulation may be failing as a result of compression. This permits the spacing between fibers or layers of fibers to increase, thereby trapping more air. This is not something I can prove through physical or microscopic inspection. As I experience a greater number of compression cycles, the nature of the physical response to compression may become clearer.
Finally, the compression method used here does not quite replicate the act of stuffing a sleeping bag or garment into a stuff sack. In these tests, compression simply removed the air from the insulation sample. Fibers were crushed down to the ground in a mostly vertical direction. The fibers were not subject to bending forces. Bending forces might diminish the fiber crimps that provide the spring to re-loft after being crushed. Certainly, fibers are bent or torqued when inserting a garment or sleeping bag into a stuff sack. So, in future tests, I will try to come up with a more aggressive test setup that will involve bending fibers past 90°. This will better replicate what happens when using a stuff sack for storing your gear.
For now, I still cannot conclude that severe degradation of synthetic insulation will occur with normal use. However, as was the case in the last article on this subject, when stuffing your garments or sleeping bags, use minimal force. If possible, try rolling the garment or sleeping bag instead of engaging in random and forceful stuffing. The only prize you get for achieving the smallest stuff sack dimensions may be a ruined garment or sleeping bag.
Related Content
- more in this series by Stephen Seeber
- listen to our synthetic insulation podcast
- research and discover synthetic insulation-based gear in our Gear Shop
DISCLOSURE (Updated April 9, 2024)
- Product mentions in this article are made by the author with no compensation in return. In addition, Backpacking Light does not accept compensation or donated/discounted products in exchange for product mentions or placements in editorial coverage. Some (but not all) of the links in this review may be affiliate links. If you click on one of these links and visit one of our affiliate partners (usually a retailer site), and subsequently place an order with that retailer, we receive a commission on your entire order, which varies between 3% and 15% of the purchase price. Affiliate commissions represent less than 15% of Backpacking Light's gross revenue. More than 70% of our revenue comes from Membership Fees. So if you'd really like to support our work, don't buy gear you don't need - support our consumer advocacy work and become a Member instead. Learn more about affiliate commissions, influencer marketing, and our consumer advocacy work by reading our article Stop wasting money on gear.

Home › Forums › By the Numbers: Crushing It – How Bad is Thermal Degradation in Synthetic Insulation?